 One of the greatest tools out there for analyzing visitors on your site is Google Analytics!
It is going to provide you with a huge quantity of data about who is coming to your site, what they are trying to find, and how they're acquiring there by having a little bit of setup. It has so very much data that it is usually overwhelming for a fact!
You too will be able to use Google Analytics like a pro with just a little training. Do not be afraid of the whole process.
Nirvana Traders and technology will give you the fullest support in terms of the analytics prepared by Google but still we are discussing the steps:
Your Account Set Up
You will need to set up an account with them in order to use Google Analytics. A unique identifier to add to your site will provide you the best!
You can't access information for other sites unless the site owner explicitly grants you access but you can only access information about your own site. There will be people you grant access to only people with access to your information.
Google Analytics, GO!
To the left of the sign-in box, click Sign Up Now, as you do not have a Google account. You can sign up for a Google account and this will take you to a page.
You can use your email address and password to sign in, if you already have a Google account.
You can continue after the clicking the Sign Up button.
It will provide Google with the URL of the site you wish to analyze in the next window.
Give an easy to remember account name for your site. This is especially important, if you will be tracking multiple sites.
Then comes the selection of the country based on your site. Along with that you can get an appropriate time.
You may want to select a U.S zone if your site is based in India but all your users are in the U.S. You may want to set it to your city's time zone to see when you need the most workers on staff with time zone to figure out when in their day most choose to use your site.
For continuing press the button to click
Provide your contact information in the next window.
For continuing press the button to click
Read the Google Analytics terms of service in the next window. Click the Yes box if you agree with them.
For continuing press the button to click
A New Account is being created!
A block of code is provided by Google. You have to insert it into your web site so copy it.
Google Analytics JavaScript Into Your Pages will be inserted
For tracking your site you need to insert the codes from Google. Give us the opportunity to make this inserted in your site with your permission. This is very important for your site - Google Analytics code.
You need to get into the guts of your page - the HTML for inserting the Google Analytics code.
You will need to open the footer.php file to place this code when you are using a service like WordPress.
Just above the </html> page, find the </body> tag at the very bottom.
Above the body tag can you see the code urchinTracker(), utmLinker(), utmSetTrans(), or utmLinkPost(). The Google Analytics Javascript above that code should be pasted. Paste it immediately above the </body> tag when required.
You can insert the code into them as well when you have templates.
You can begin tracking information, once you have uploaded the pages back to your site!
Google Analytics code on other sites insertion
TypePad on Google Analytics
Your Site Performance Overview
Google Analytics has great charts that will give you an overview of your site's performance, if you know how to read them, by the moment you set up your account and insert Google's JavaScript into your pages.
Google Analytics login
A section titled Website Profiles in the center of the page. The name of the site you're interested in and you can click on the View Reports link to the right of it. You can get a visual representation of your site traffic over the past month at the top of the page which is a chart. The Dashboard will be brought about by you.
From the time you inserted the tracking code into your pages this chart will be only given to you.
You can click on the dates in the upper right-hand corner when you want to change the span of time the chart displays. The calendar is revealed or manually type in dates to view a different span of time when clicking on to the dates.
You can select one date range you want to use, click Compare to Past, and select the range you wish to compare it against while you are comparing to change the span of time the chart displays.
You can click Compare to Past, and select the range you wish to compare it against, you can compare traffic over two different time periods, select one date range you want to use.
The dates are often a menu that says Visits just under it. You can click to view the portion of new visits (how quite a few visitors had by no means been to your site prior to), bounce rate (what percentage of end users left after going to only 1 page), average time on site (how lengthy each and every user spent on your site), web pages per visit (how numerous pages on your site customers visited on typical), alter the graph to pageviews (how quite a few times the webpages on your site have been completely viewed).
You will see a header that says Site Usage, with six small charts underneath that chart. You will find quick information on various site traffic statistics for the time period shown in the main chart under the site usage. One has an individual chart with each.
How many visits there were to your page as per the visits? The user has viewed no other page on your site in the past half hour if is the visitor to your page.
The pages on your site have been viewed by the Pageviews.
On average, users view when they come to your site how many pages is being visited.
What percentage of users left after viewing only one page on your site is the Bounce Rate.
Time on Site shows how long each user spent on your site on an average.
What percentage of your users has not visited your site before every new visit?
Overview graph shows how many visitors have come to your site in case of the Visitors.
The Visits statistic, sometimes a lot lower, because some visitors may visit your site over and over again as the number is usually lower.
View Report to view more detailed information about your visitors on each click.
You can view Report to view more detailed information about your visitors by clicking.
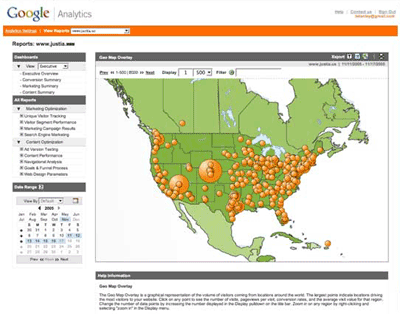
You can get to view from which country with the help of the "Map Overlay".
The more visitors come from that country, the green becomes darker.
For depth information you can again click on the View Report.
You can check the percentage of users are getting to your site by typing your URL directly into their browser, and via search engines, referring sites, and other avenues such as emailed links by Traffic Sources Overview.
You can get what keywords the visitors are looking for by clicking on the View Report to get breakdowns of exactly what places your users are coming from.
The top five most viewed pages over the time period you're looking at can be checked by Content Overview.
You can get the detailed information on every page as how many of them were new to the page, how long they spent on the page, where the people viewing that page came from.
For accessing the information about the performance of all pages on the site you can click on to the View Report.
Daily and Hourly performance of your site
Google Analytics can tell you whether your site has peaks during certain times of day or on certain days of the week.
You can click on the word Visitors in the menu to the left.
You can see a number of different statistical breakouts to the left beneath the main chart.
The daily performance for that aspect of site traffic measurement is done by clicking Click on any of the words to get a bar-chart breakout.
Click on the word Hourly above the bar chart to see an hour by hour graph for the time period at hand if you want to learn hour-by-hour trends.
Click on the dates above the line graph. Select the first set of dates you want to work with, check the Compare to Past box, click on the second set of dates, and click the Apply Range button when you want to compare two different time periods.
Traffic Comes From, Where
You may question whether you are getting most of your traffic from search engines or not. Whether the bunch of traffic is being coming from the blog links of your pages?
How will you easily find that out from you page??? You can check the Dashboard you'll find your site's top 5 most-accessed pages in the lower right-hand corner.
You will see a heading labeled Landing Page Optimization below the chart on the right hand side. It labeled Entrance Sources on the link beneath.
You can check a table beneath the chart. This will be the exact list of users those are coming to visit your site as shown in the table.
There is the number of pageviews your page received from that source which is in the first column to the right of the source name.
There is someone coming to your page who had not been to that page before in the time frame you're reviewing will be shown on the next column tells how many of those were unique pageviews.
How much time, on average, users from that particular source spent on the page in question by the time on Page tells you how much time?
How many people from that specific source left your site after looking at that page, without viewing another page will be shown by Bounce Rate.
The specific source went to another site from that page % Exit shows how many people from that.
Google will crunch the numbers to show you how much return you're getting with the $ Index column, when you set up certain financial measurements in the Goals section.
Under the Content menu on the right, click on the Content by Title menu item you can the Content menu on the right, click on the Content by Title menu item.
Now at the end after reading all the information of every page you can return to the main dashboard by clicking on the word Dashboard in the upper-left corner to it.
 Evaluation:
We at Nirvana Traders and Technology are giving you this report in a detail format so that you do not have to take the headache. Believe in the experts to get the best result that you deserve from your site.
We love to give you all the required data in an organized format so that you can make things go smooth in it. In fact when you are checking all the evaluation of your campaign then only you can take further steps to modify the campaign.
All these information are quite specified for your field so that you can check all the necessary attributes of your visitors and also the detail analysis of your Search Engine Optimization procedure and give you a detail what is your stand.
Nirvana Traders and Technology is providing you the best update that you can get from nowhere!